The marking's done. Now see what it's telling you.
As you approve marks, they roll up on their own: which assessment objective is weakest, which questions caught people out, and who needs you first. No spreadsheet, no extra admin.
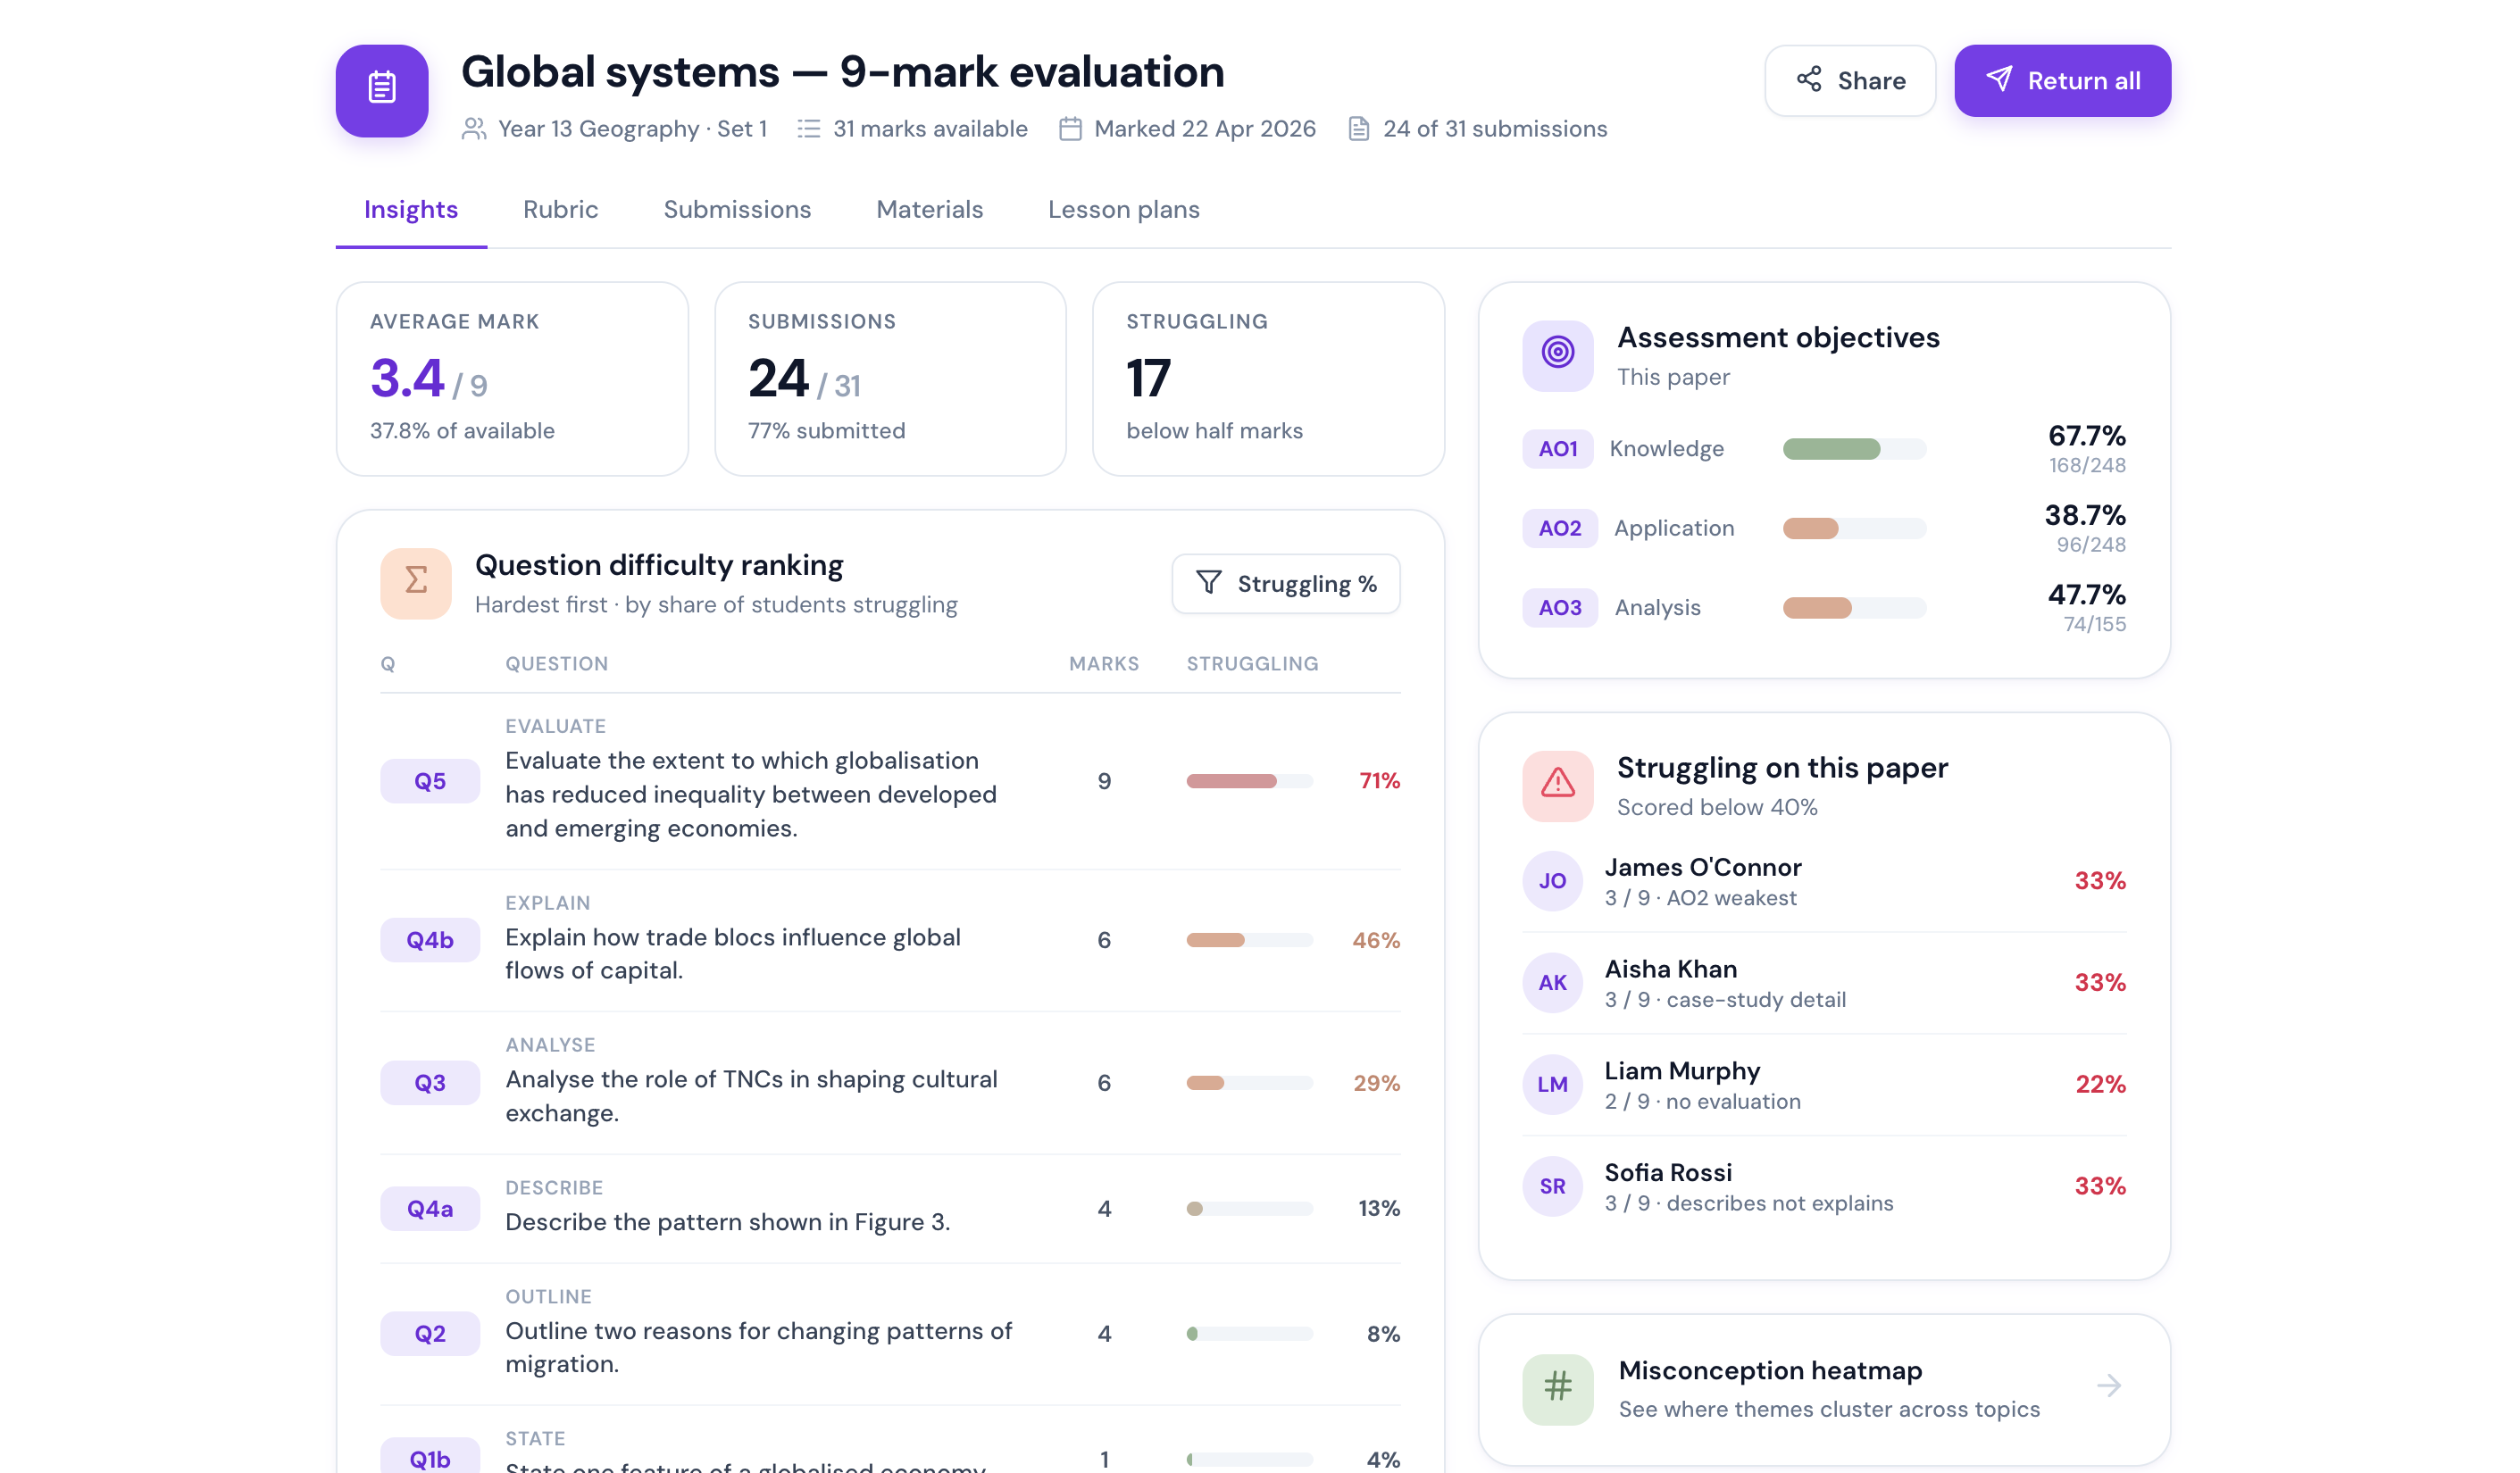
A read on the class you can act on by Monday.
AO breakdown
See performance split by assessment objective, so you know whether it's knowledge, application or analysis that needs work.
Question difficulty
The hardest questions ranked by the share of students who struggled, so reteaching starts in the right place.
Who needs you first
Students scoring below the threshold are surfaced with a short note on where they're losing marks.
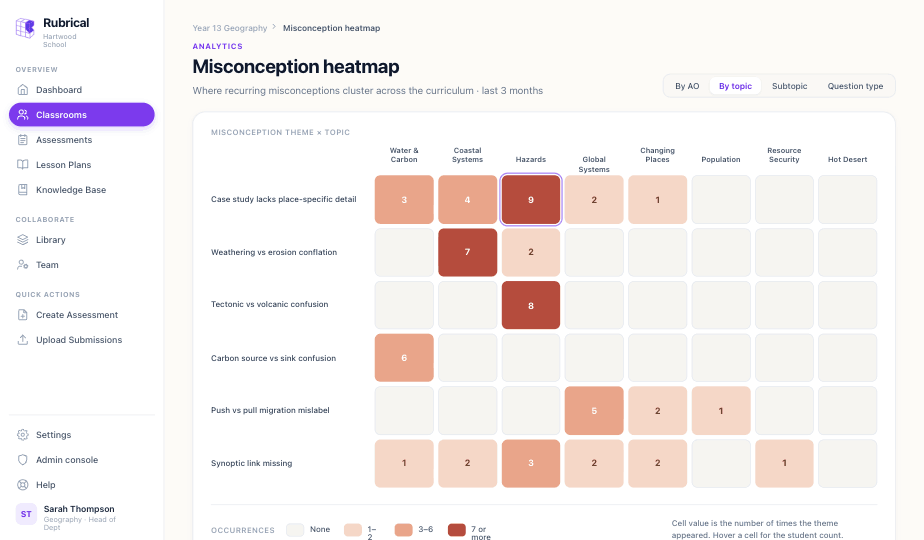
See the errors that repeat across a topic.
Rubrical groups the misconceptions it finds and lays them out by theme and topic. The dark cells are where an error keeps coming up, so you can plan one lesson that fixes it for the whole class.
- Switch the grid between assessment objective, topic, subtopic and question type.
- Hover a cell for the student count behind it.
- Built from real marked work, not a survey.
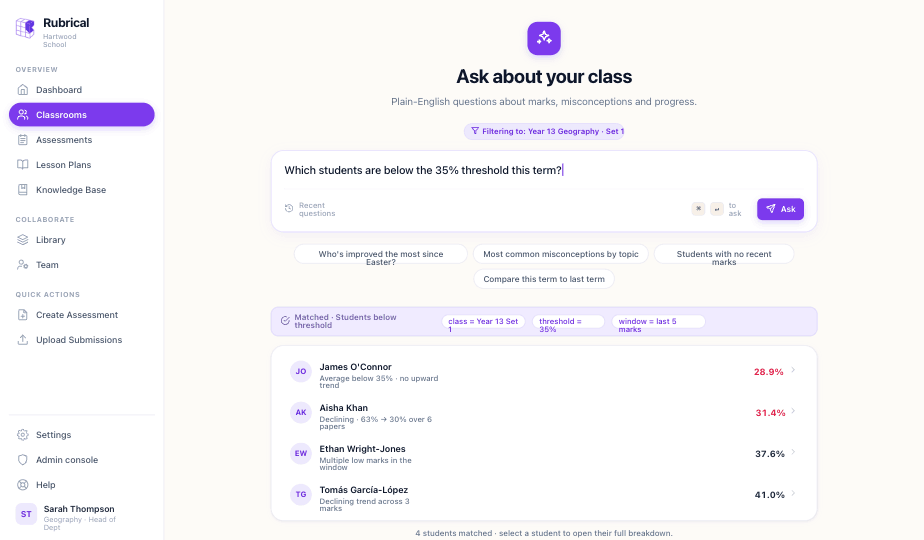
"Which students are below the threshold this term?"
Type a question the way you'd say it. Rubrical answers from your marked work and shows what it matched and which filters it used, so you can trust the answer.
- Every answer shows the pattern it matched and the filters applied.
- Scoped to the class or assessment you're looking at.
- Honest when there's nothing to show, rather than guessing.
Insight is only useful if you can act on it.
Because planning, marking and analytics live in one platform, every finding has a next step that's a click away.
A weak assessment objective
AO2 sitting at 38.9% across the cohort? Build a lesson that targets application, straight from the analytics, grounded in your spec.
Plan a lessonA misconception that recurs
The heatmap shows "tectonic vs volcanic confusion" clustering in Hazards. Reteach it once, for the whole class, before the mock.
See the heatmapA student falling behind
Three students below the 35% threshold are surfaced with where they're losing marks, so support lands early, not at report time.
See it in actionFrom one class to the whole department.
The same picture scales up. Compare sets, see a year group at a glance, and know the marking standard is the same whoever taught the class.
Consistent standards
One rubric, applied the same way across every teacher and set.
Term trends
Watch a cohort's averages move over a half-term, term or year.
Evidence ready
A clear record of attainment and intervention when you need it.
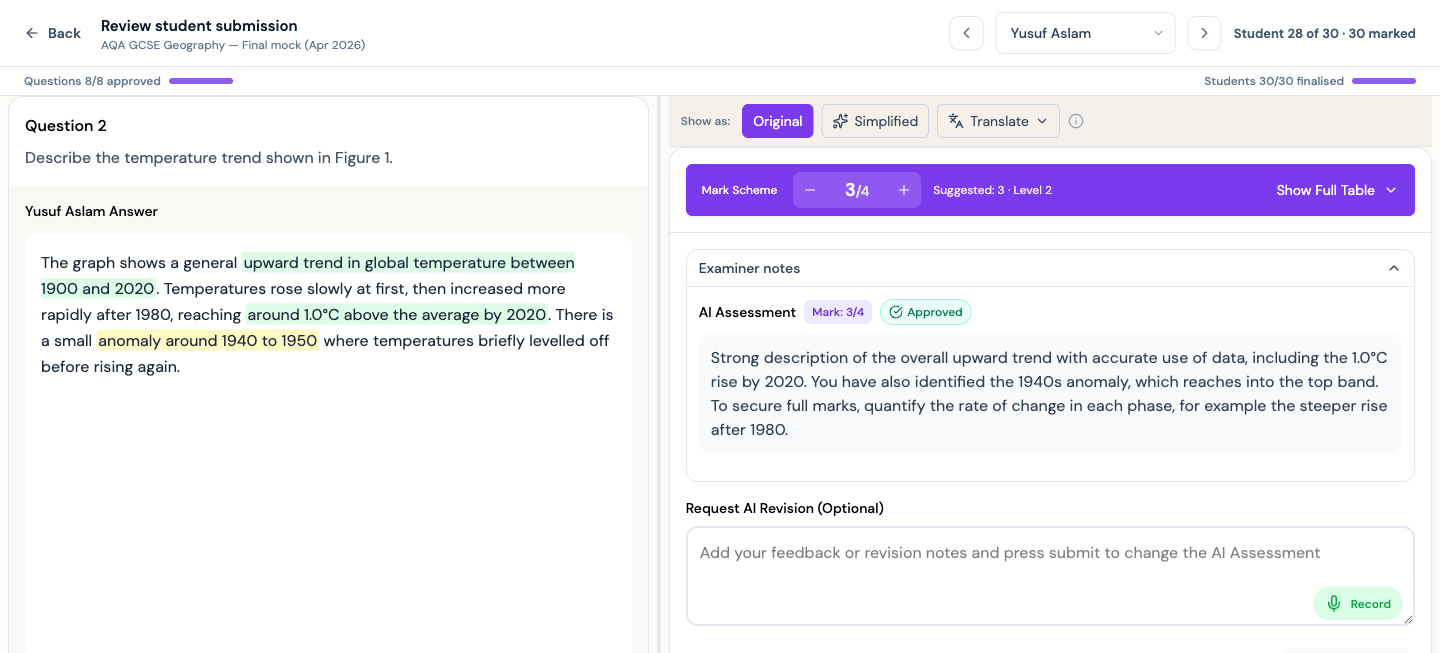
Insight is no good if a student can't read it.
Feedback can be simplified, scaled up, set in OpenDyslexic or translated into a student's first language. The settings follow the teacher across devices, so it just works in the lesson.
Turn your marking into insight.
See your own data in Rubrical on a short call. Bring one class's marks and we'll read them together.